The focus of this report is on the use of suspension and other forms of exclusionary discipline impacting the education of Black children and youth in California public schools. We report on publicly available data from the 2018–2019 school year, which is the most recent data available. However, some 2019-2020 data are provided based on proportionality ratios (due to COVID 19). These data were reported by local educational agencies (LEAs) to the state government. Before being reported, the data are certified by authorized personnel at the LEA level. Thus, the data represented in this report were reported to the state by the schools and districts.
Suspending Our Future:
How Inequitable Disciplinary Practices Disenfranchise Black Kids in California’s Public Schools
by J. Luke Wood, Frank Harris III, Tyrone C. Howard, Mohamed Qas, Idara Essien, Tina M. King, and Valentin Escanuela
In this report, we present analyses of publicly available statewide data on the suspension of Black students in California’s public schools.
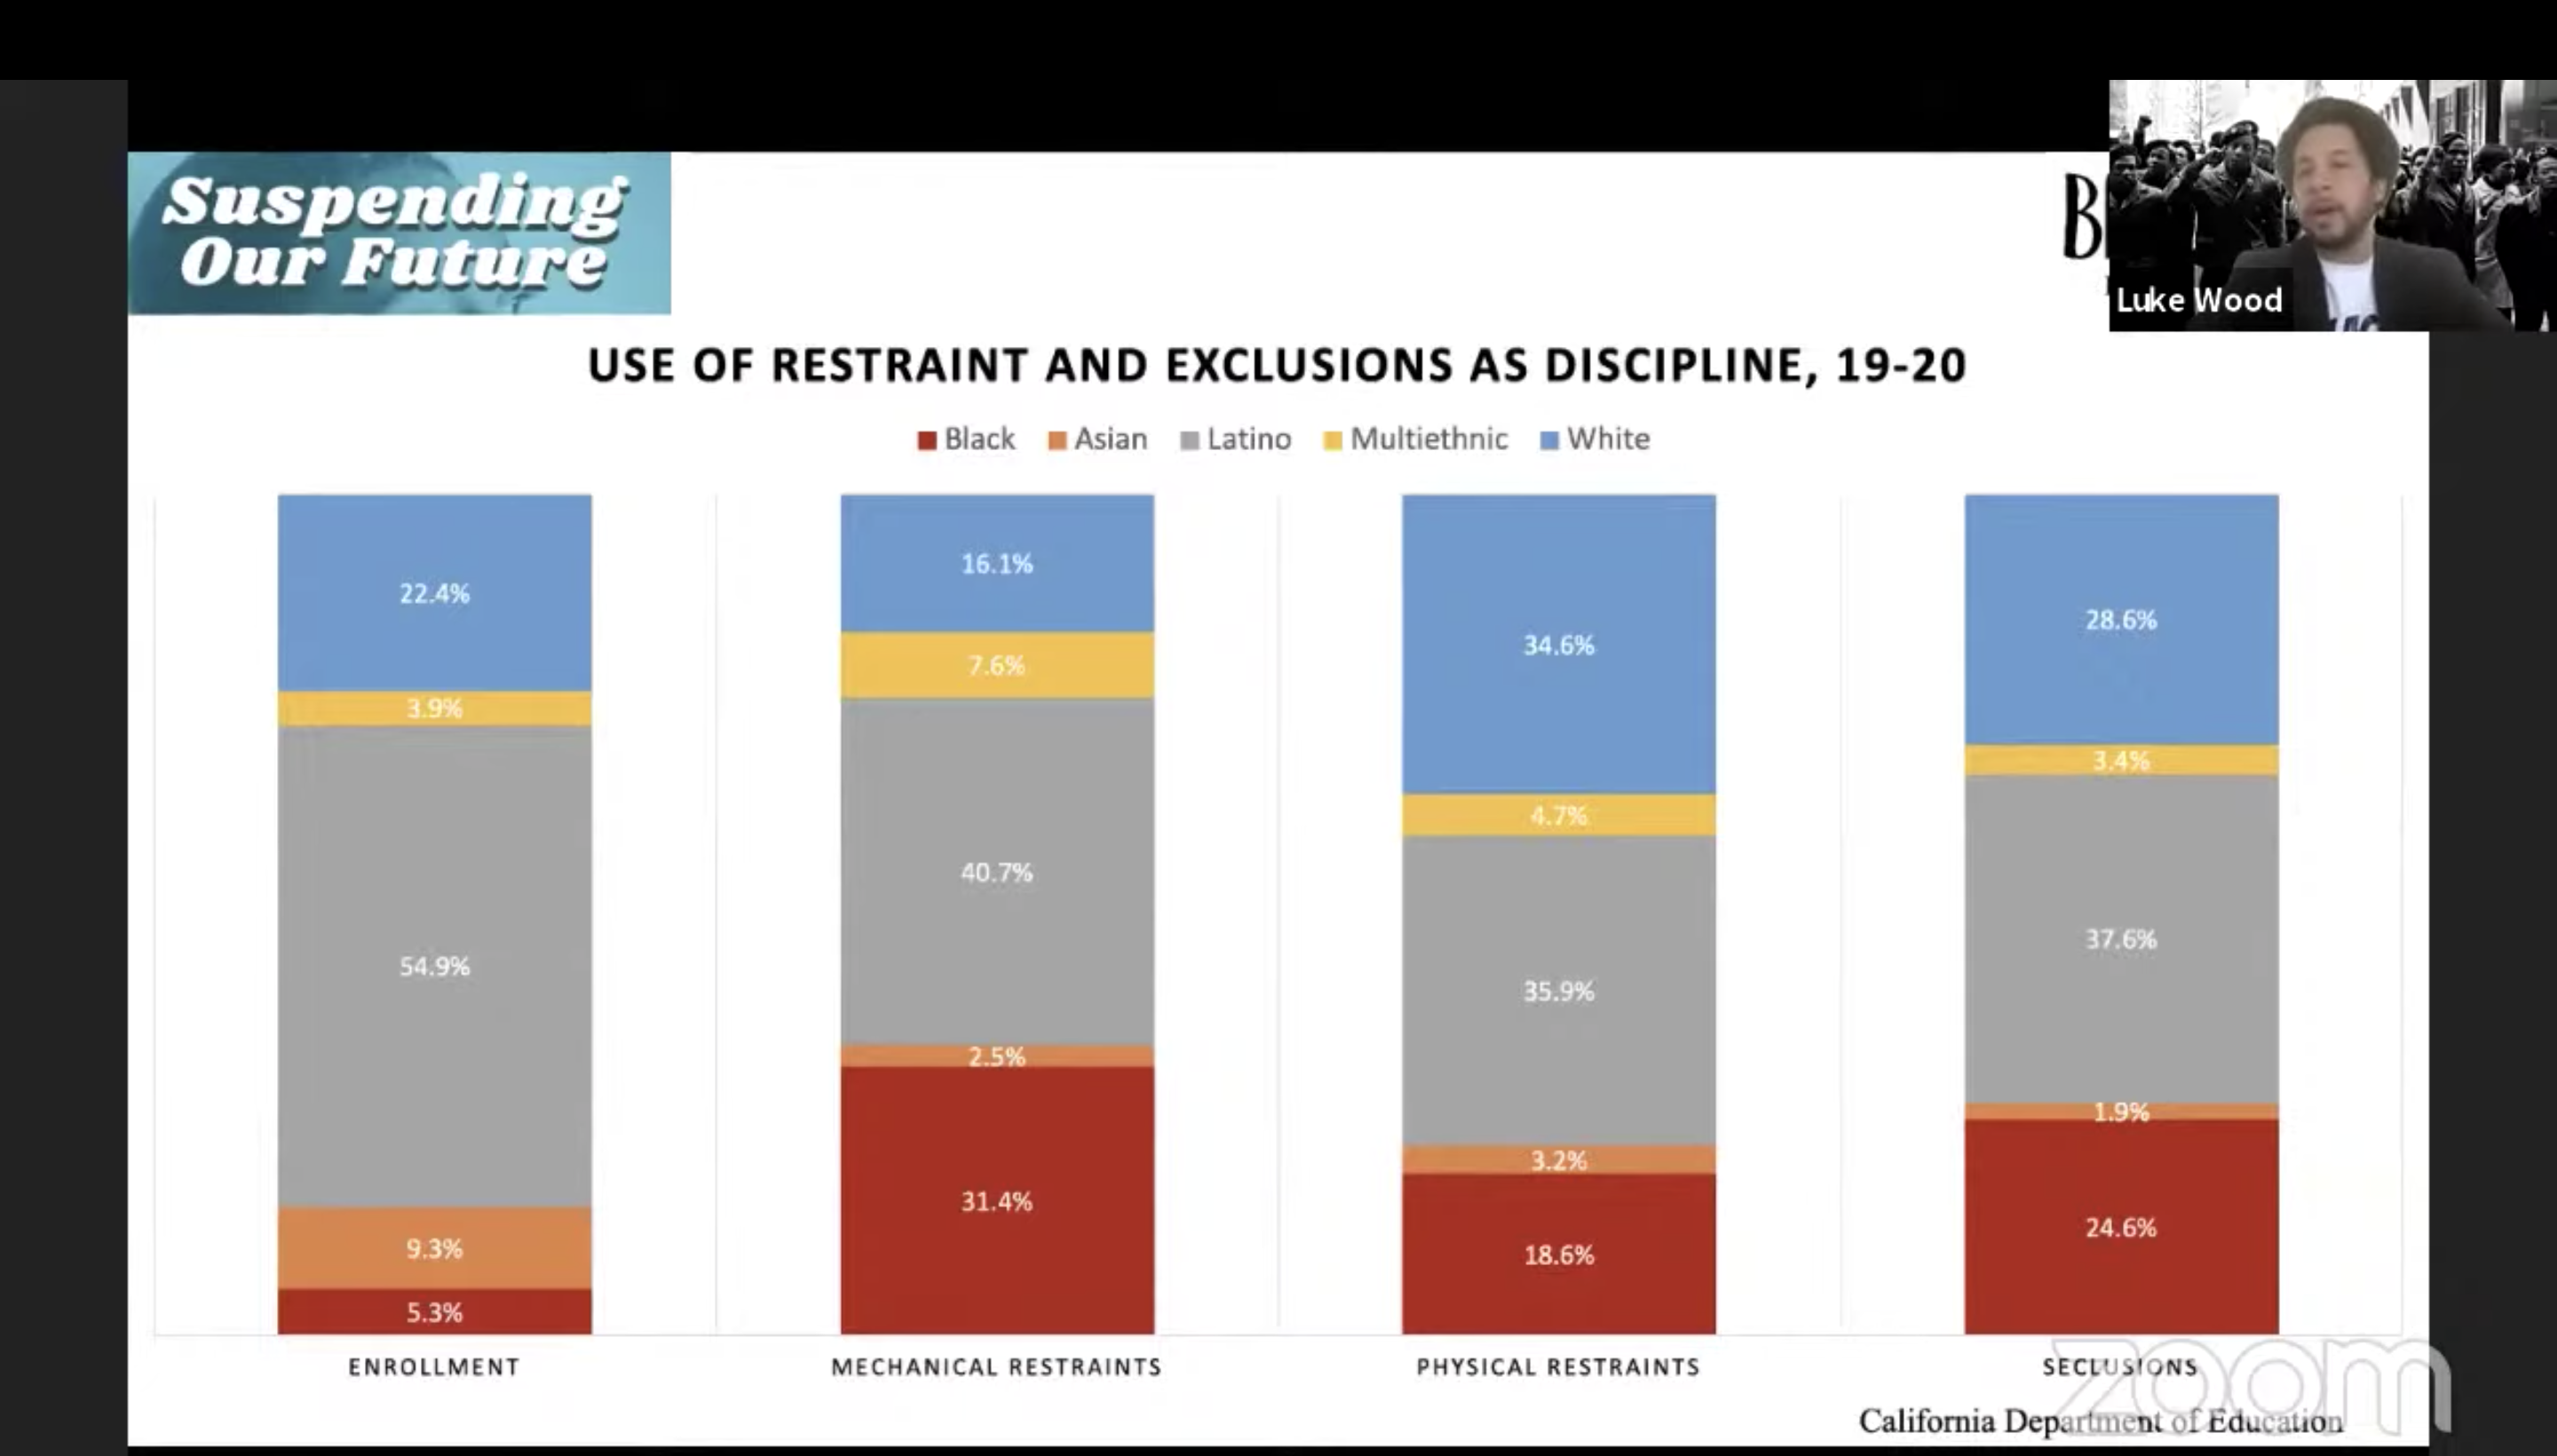
- Based on the 2019–2020 data, Black students accounted for 5.3% of statewide enrollment, and they were significantly overrepresented among those who experienced restraints and seclusions. More specifically, they accounted for 31.4% of mechanical restraints, 18.6% of physical restraints, and 24.6% of seclusions.
- The statewide average for suspension for all students was 3.5% in 2018–2019. However, the rates for Black children and youth are higher than this statewide average, at 9.1%. This suggests nearly 1 in every 10 Black children are suspended in a given academic year.
- The suspension rate for Black nonbinary students is 732% higher than the statewide average.
- The highest suspension disparities are evident in early childhood education, in kindergarten through third grade. At this level, Black male students are 6.2 times more likely to be suspended than their same-grade peers.
- The highest suspension rates among sub-groups are for Black and Native American foster youth, at 21.8% and 18.4%, respectively. Compared to the statewide average, this suggests Black and Native American foster youth, at 523% and 426%, are more likely to be suspended than their peers.
- The highest suspension county was Modoc County, with an average suspension rate of 25%. This is followed by Amador County (at 23.1%), Glenn County (at 16.7%), Madera County (at 16%), and Plumas County (at 15.4).
- The highest suspension district for Black students was Sutter County Office of Education, which suspended 30.8% of Black students in 2018–2019. This district is followed by Modoc Joint Unified (at 28.6%), Bayshore Elementary (at 27.8%), and Miller Creek Elementary (at 26.7). Both El Monte Union High and Upper Lake Unified are tied with a suspension rate of 25%.
- Although the majority of schools in the top 100 suspension schools in California are traditional public schools, only one school in the top 20 suspension schools is a traditional public school: Hoover Herbert Middle School in San Francisco Unified, with a suspension rate of 59.1%. This rate is 16.9 times greater than the statewide suspension average.